

Bad actor equipment is the small group of assets or components that creates a disproportionate reliability burden through repeated failures, downtime, maintenance cost or consequence. The practical challenge is deciding which assets genuinely deserve attention first, because the loudest or most frustrating machine is not always the one creating the greatest business impact.
The core distinction is simple: bad actor analysis tells you where to look first. It does not yet tell you why the asset is failing or what the right corrective response should be.
Bad Actor Equipment: Start With the Assets Creating the Most Business Pain
On site, these assets are commonly called bad actors, problem children or repeat offenders. The label is useful because most maintenance teams already know the equipment that seems to keep coming back, but reputation alone is not a reliable prioritisation method.
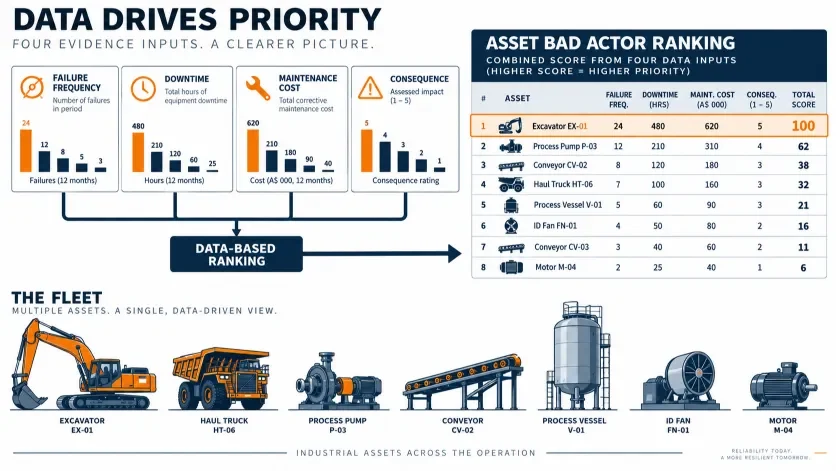
A better starting point is to look broadly at the business burden the asset is creating. We typically start with measures such as maintenance cost, downtime or production loss, then drills further into parts consumption, repeat workshop visits and failure count. The aim is to find where the largest reliability losses are concentrated before assigning limited engineering resources.
This is also where how to identify bad actors in maintenance becomes less about a single formula and more about choosing the right measure for the problem you are trying to solve. If production interruption is the main concern, downtime may be the most useful starting measure. If maintenance spend is climbing, repair cost or material consumption may tell you more.
Use Pareto Analysis to Focus the Reliability Work Queue
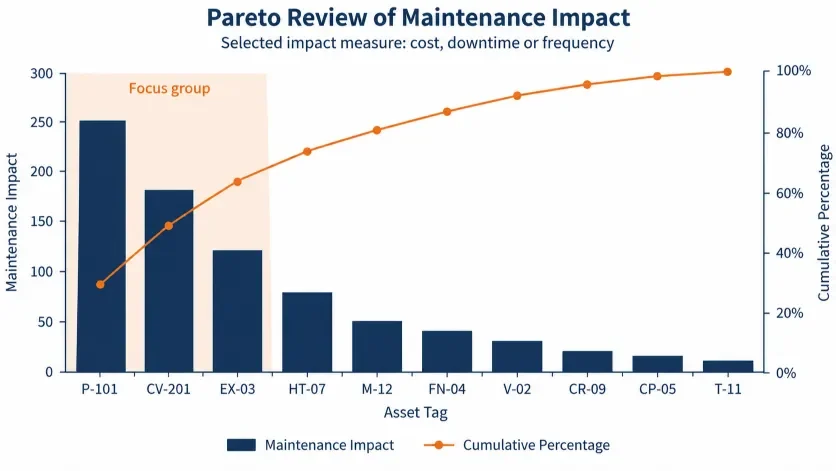
A practical bad actor analysis often starts with Pareto analysis. Rank the assets from greatest to least impact using a measure that reflects the current business problem, such as downtime, maintenance cost, failure frequency or lost production.
The familiar 80/20 principle is useful as a focusing idea, but it should not be treated as a fixed rule. The actual distribution may be very different. What matters is whether the analysis helps reduce hundreds or thousands of assets to a manageable group that deserves closer attention.
Our experience is that the active list needs to match the size of the reliability team and the scale of the asset population. A team may monitor a larger group but actively work only a few of the highest-value opportunities at any one time, because trying to solve too many problems at once spreads engineering effort too thin.
An equipment failure Pareto analysis is therefore most useful when it becomes a work queue, not just a chart. It should tell the team which assets need validation next and which ones can remain under observation.
Failure Frequency Alone Can Point You at the Wrong Asset
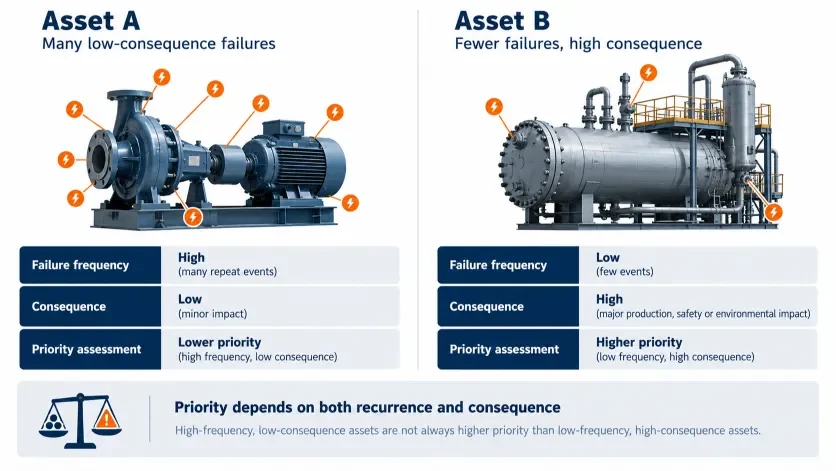
Failure count is easy to understand, but it can distort the priority if it is used on its own. A component that fails every few weeks may be cheap and quick to replace, while another asset may fail only occasionally but cause substantial production loss, safety exposure or consequential damage.
Asset criticality helps bring consequence into the decision. Depending on the site, that may include safety, production, environmental impact, regulatory exposure, repair cost and the operational importance of the equipment.
We have seen this trade-off first-hand with front windows on rock breakers. The initial cost comparison suggested that repeatedly replacing the standard windows was no more expensive than moving to tougher glass. A maintenance supervisor then pointed out what the cost calculation had missed: each replacement brought the machine back to the workshop, interrupted production and required maintainers to work at height from a ladder. Once those effects were included, the priority looked different.
This is why the cost of unreliability can be broader than the repair invoice. Frequent low-cost failures and less frequent high-consequence failures can both deserve attention, but for different reasons.
Validate the Data Before You Trust the Bad Actor List
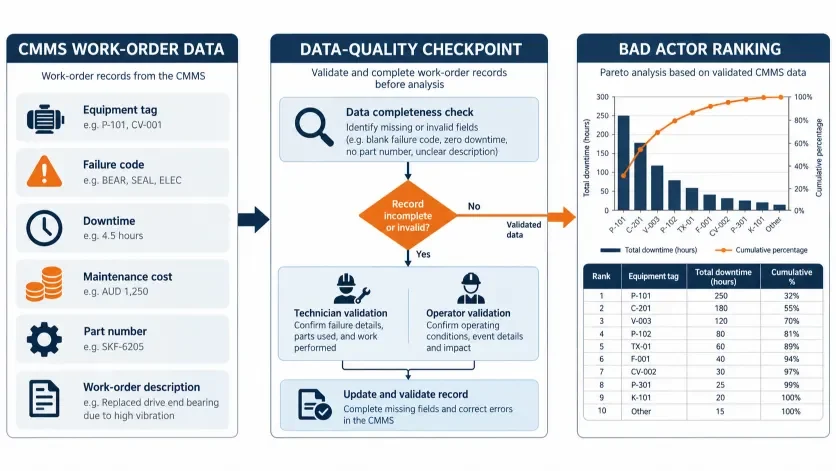
A polished ranking can still be wrong if the source data is poor. Before acting on the list, check the CMMS records behind it: equipment tags, work-order types, failure codes, downtime, repair cost, part numbers and close-out descriptions.
We treat the data as an indicator that tells the reliability team where to investigate further. We have seen cases where the apparent pattern pointed toward high O-ring consumption, but discussions with the maintenance team showed that the O-rings were often replaced because hydraulic hoses were being changed. The recorded part consumption was real, but the initial interpretation of the problem was not.
That is why CMMS data and site knowledge need to validate each other. Where structured coding is weak, keyword searches across notifications, part-number searches and direct discussion with fitters or operators can help establish whether the pattern is genuine.
The same principle applies to maintenance bad actors more broadly. Data should guide attention, but the reliability team still needs to confirm what is actually happening before it commits to a solution.
A Bad Actor Asset Can Contain Several Different Failure Modes
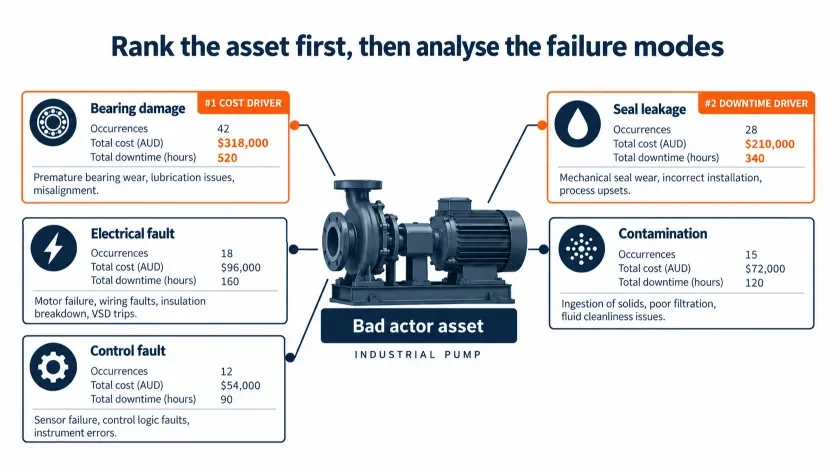
Once an asset has made the shortlist, the next step is to separate its history into failure modes. One pump may have repeated seal leakage, an electrical fault, bearing damage and contamination events. Treating all of those jobs as one bad actor problem can produce a poor investigation because the events may have different mechanisms and different solutions.
Review the failed component, the way it failed, the operating conditions, the parts replaced and the evidence left behind. Then identify which failure mode or small group of related modes is driving most of the downtime, cost or recurrence.
This distinction matters particularly with chronic equipment problems. An asset can remain on a bad actor list for a long time even though the dominant failure mode changes, which means the response may also need to change.
If you are still establishing whether the same problem is actually recurring, see when the same equipment keeps failing for a practical way to separate repeat asset events from repeat failure modes.
Decide What the Bad Actor Needs, Not Whether It Needs RCA
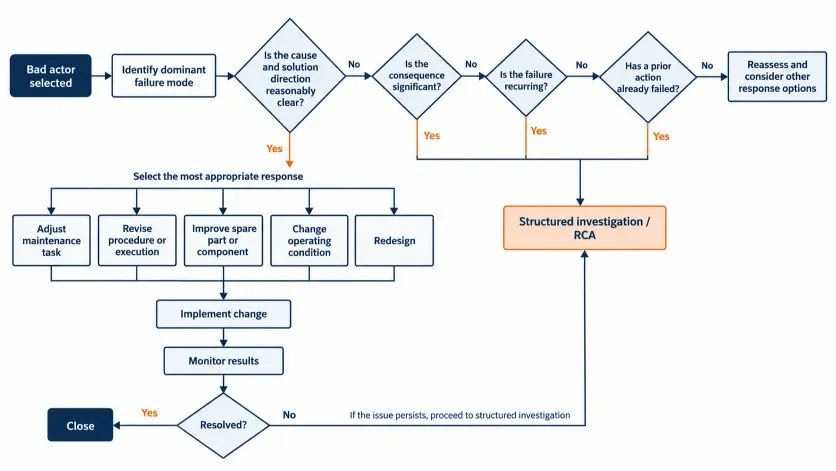
Being on the bad actor list does not automatically mean the asset needs a formal root cause analysis. First ask whether the dominant failure mode is already understood and whether the maintenance strategy, procedure, component specification or operating condition can be adjusted with confidence.
The right response might be a PM change, a revised work method, a component change, better contamination control, redesign or an operational control. The important point is to match the response to the failure mode and the evidence, rather than treating RCA as the default next step.
When a significant recurring failure mode remains uncertain, is disputed, or continues after previous corrective action, the Practical RCA Toolkit can help determine whether the problem is ready for a deeper investigation and what evidence should be preserved.
Our own approach is to address the event-based problems. If a monitored bad actor experiences another significant failure, that event can create the opportunity to take the equipment out of service, preserve the failed parts and investigate the actual conditions present at failure. The trigger is not a universal number of failures. It is the point where consequence, recurrence and uncertainty justify the effort.
At that stage, the Apollo Root Cause Analysis methodology can provide the structure needed to map the causal relationships and test them against evidence.
Measure Whether the Asset Actually Stops Being a Bad Actor
The improvement loop is not complete when actions are assigned. The asset needs to return to service and be monitored against the same measures that placed it on the bad actor list in the first place.
We commonly review bad actor performance month to month, then looks across a longer period to see whether the improvement is sustained. Depending on the failure frequency, that may take several months. The useful test is whether the targeted failure mode, downtime, repair cost or failure count genuinely moves in the right direction.
If the same failure mode remains dominant, the team should revisit the diagnosis, action implementation and data quality. If the asset improves, it should naturally move down or off the list while new problems rise into the reliability work queue.
This keeps the bad actor process objective. The purpose is not to permanently label a particular machine as troublesome. It is to identify what is creating the greatest reliability burden now, address it, then continue monitoring.
A Practical Bad Actor Review for a Reliability Team
A useful review can be kept straightforward. Choose the asset population and time period, select the measure that reflects the business problem, rank the assets, validate the top group with site knowledge, then break each shortlisted asset into its dominant failure modes.
From there, decide the most appropriate response for each problem. Some will need maintenance optimisation, some will need engineering changes, and a smaller number will justify structured investigation. The reliability team should actively work only as many as its available capacity can support properly.
Where an organisation repeatedly identifies significant bad actors but relies on a few experienced engineers to investigate them, building a shared RCA capability can help make the next step more consistent. Training should not replace prioritisation or maintenance strategy, but it can give engineers and managers a common method for testing causes and developing evidence-based actions.
Common Questions
What is bad actor equipment?
Bad actor equipment is an asset or component that creates a disproportionate reliability burden through repeated failures, downtime, maintenance cost, production impact or another consequence important to the organisation.
Should bad actors be ranked by failure count?
Failure count can be useful, but it should not be used alone. Downtime, repair cost, production loss, safety exposure and asset criticality may change which asset deserves attention first.
Does the 80/20 rule always apply to bad actor analysis?
No. Pareto analysis is useful for focusing attention on the largest contributors, but the actual concentration of failures or cost does not have to follow an exact 80/20 split.
Does every bad actor need a root cause analysis?
No. Some problems can be addressed through maintenance strategy changes, procedures, component changes, operating controls or redesign. Structured RCA is more appropriate where a significant recurring failure remains uncertain or resists previous corrective action.
